How are THC and CBD levels measured in cannabis?
Under the legal framework governing cannabis use, cannabis plants and products must be tested before being placed on the market. Certain limits have therefore been established, such as a maximum THC content of 10 mg per unit in the case of edibles in California, which is why highly accurate cannabinoid concentration tests are necessary.
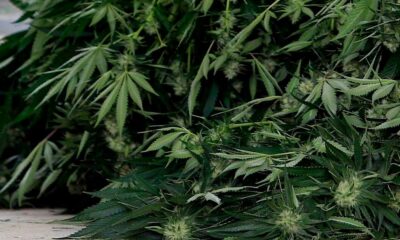
The need for robust methods is even greater when one considers the wide variety of products: flowers, oils, concentrates, and edibles. But how do you measure the amount of THC in a product?
How is the THC content of cannabis measured?
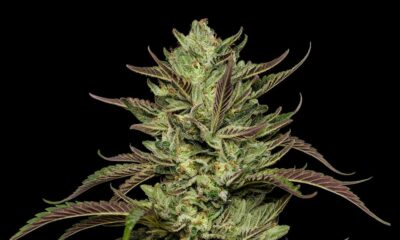
Potency is a measure of the concentration of delta-9-tetrahydrocannabinol (THC) and is often expressed as a percentage by weight. The THC is the psychoactive ingredient the main component of the cannabis plant, but most of the THC in cannabis exists in the form of a precursor molecule, the’tetrahydrocannabinolic acid (THCA), a non-psychoactive cannabinoid.
As shown in the diagram below, the loss of the carboxylic acid group from the When heated, THCA produces THC. The potency is therefore calculated based on the concentration of the two molecules, using the following equation: % total THC = % THC + (% THCA × 0.877).
This conversion factor accounts for the weight of CO2 lost during the thermal decarboxylation.
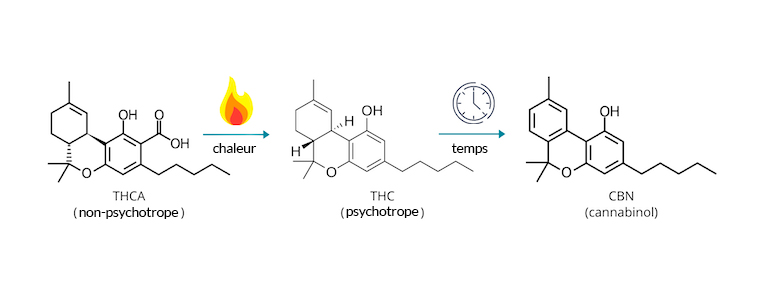
Conversion of THCa to THC and then to CBN
With this information in hand, it is important to understand the method used to test your samples. Regulatory standards in France do not currently specify standardized methods for potency testing. It is therefore up to the laboratory to develop internal methods that ensure both a high level of accuracy and precision.
Several analytical methods are commonly used in the industry to test activity, including gas chromatography (GC), high-performance liquid chromatography (HPLC), and nuclear magnetic resonance (NMR).
Gas chromatography and high-performance liquid chromatography are the most commonly used methods and are coupled with various detectors, such as mass spectrometry (MS), ultraviolet (UV), or triple quadrupole mass spectrometry (QQQ-MS).
Why is the selection of measuring instruments important?
Instrumentation is key to understanding your results. In gas chromatography, the sample is heated before being introduced into the separation column. As mentioned in the previous paragraph, this heating process will convert all THCA into THC. If you want to know the percentage of THC and THCA in order to calculate potency, gas chromatography is not the appropriate analytical method.
HPLC, on the other hand, does not require heating the sample and relies on solvents to move the sample through the separation column. This allows for the quantification of both THC and its precursor, THCA, enabling a more accurate determination of potency.
What else needs to be taken into account?
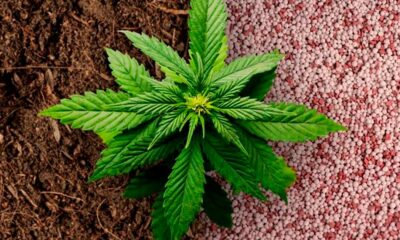
Instrumentation is only one part of the process, and many other factors must be taken into account to ensure data quality. How the sample is prepared or extracted before being analyzed by the instrument is just as important. The extraction solvent, homogenization strategy, and storage temperature all play a critical role in the effective isolation and preservation of your key targets, THC and THCA.
Storage temperature
It is well known that THC concentrations decrease over time at high temperatures due to degradation into cannabinol (CBN). A study conducted by an independent laboratory (CARO in Canada) showed that this effect was most pronounced in the concentrate and oil samples, which exhibited an average reduction in potency of approximately 6% after 3 months of storage at room temperature.
This highlights the need to consider the environment in which samples are stored, both in the laboratory and throughout the product’s lifecycle prior to sale. Exposure to light or oxygen also accelerates this process and reduces THC concentration through conversion to CBN.
Homogenization
Homogenization is the process of preparing the most uniform and representative sample possible for analysis. It is also the step where differences between matrices are most apparent (what works for dried flowers must be adjusted for concentrates, for example). Typical procedures include grinding and/or sonication and must be carefully selected to ensure the accuracy of the report.
Extraction
Determining the sample size used in the extraction process is a delicate balancing act. From a statistical standpoint, a larger sample volume will yield data that is more representative of the batch. In reality, the cannabis matrix is complex, and the fatty acids naturally present in the plant can cause matrix interference that increases proportionally with the increase in sample volume. A balance is therefore necessary to increase accuracy without significantly increasing matrix effects.
How can you tell which data to trust?
If you’ve read this far, you may be wondering whether the power data are truly reliable, given the number of challenges outlined above (lack of standardized methods, variation associated with the sample matrix, high temperatures, extraction considerations, etc.).
As part of these programs, a standardized sample is distributed through a network of laboratories for analysis, and the results are compared. This third-party blind testing system allows for the assessment of laboratory proficiency and helps level the playing field in sectors where standardized methods have not yet been implemented.
What about CBD or CBG?
Although the focus has been on THC or THCA, similar principles apply to other cannabinoids. The cannabidiol (CBD) is the second most common active ingredient in cannabis, after THC, and has garnered interest for its synergistic effect with THC, as well as for its standalone benefits in a variety of applications, including epilepsy, inflammation, and anxiety.
Cannabidiol (CBD) generally attracts as much interest as THC and undergoes a similar thermal decarboxylation pathway from its parent compound, acid cannabidiolic acid (CBDA). A typical potency test can indicate the concentration of CBD and CBDA, as well as a wide variety of other cannabinoids.
The same applies to the cannabigerol (CBG) which is produced by the breakdown of the’cannabigerolic acid (CBGA).
The same principle is applied when calculating the total CBD and total CBG percentages, with a conversion factor of 0.877 for CBD and 0.878 for CBG.
The final THC content depends on the method of consumption
To better understand how different consumption methods affect decarboxylation rates and the final THC content of cannabis products, let’s turn to Rudolf Brenneisen, PhD. His laboratory at the University of Bern in Switzerland has conducted extensive research on how decarboxylation rates and THC bioavailability are influenced by different products—particularly vaporizers—and routes of administration.
Dr. Brenneisen explains that «the efficiency/decarboxylation rate depends on the temperature and heating time, as well as the vaporizer’s design and technology.».
His laboratory specifically studied how different vaporization temperatures and different products affect the efficiency of THCA conversion to THC in cannabis flowers and extracts.
«Heating cannabis extracts »Heating to 200°C for five minutes causes nearly 100% of the THCA to decarboxylate into THC, without forming CBN," he explains.
The decarboxylation of THCA into THC begins to occur at around 180°C. As you increase the temperature, other compounds such as terpenes begin to vaporize, each at a different temperature. At even higher temperatures, combustion begins to occur. This affects not only THC and other cannabinoid levels, but also terpenes. In addition, combustion can produce byproducts that may be harmful to your health.


The «cannabis» fine raised to 500 euros under the RIPOST Act

Sacha Baron Cohen Brings Ali G Back to Life During a Surprise Appearance at Wimbledon

Botswana Paves the Way for Commercial Hemp Cultivation

The First Authorized Medical Cannabis Cultivation in the Canary Islands

Germany Ends Public Health Insurance Coverage for Medical Cannabis Flowers

Cannabis Legalization in Pennsylvania Once Again on Hold

Democratic senators are reviving a bill to legalize cannabis at the federal level in the United States

A THC:CBD oil shows promising results in reducing agitation in people with dementia

San Francisco Allows «Cannabis Cafés»

You must be logged in to post a comment.